

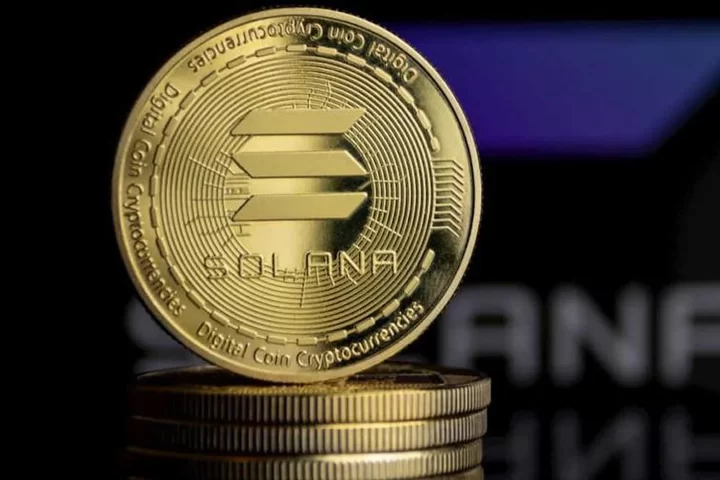

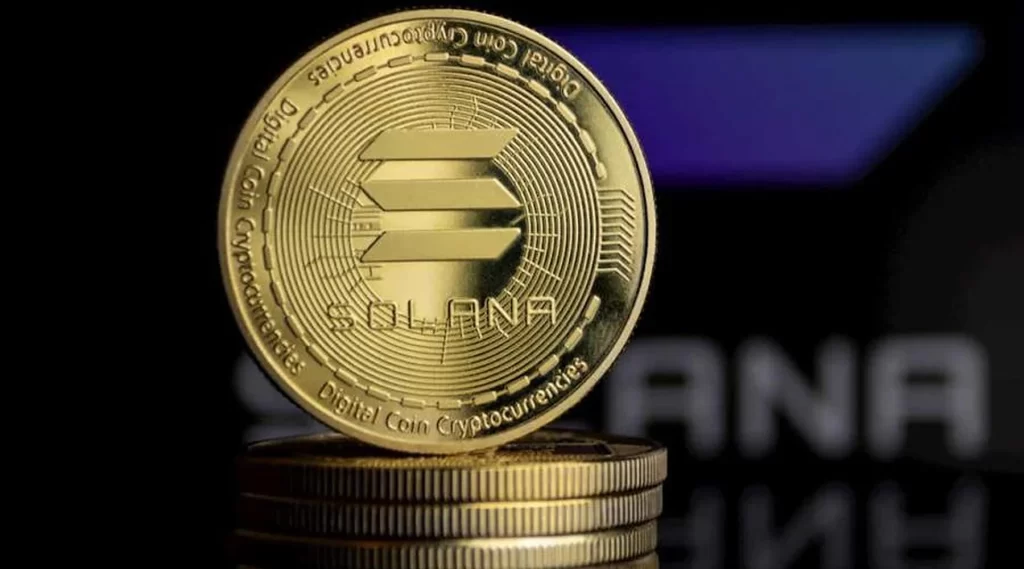
US spot Solana exchange-traded funds had their strongest week since launching, drawing $188.21 million in net inflows between September 21 and 25. The total shows growing institutional appetite for SOL even as the wider crypto market has cooled in recent days.
All seven funds finished the week with positive flows. Bitwise’s Solana Staking ETF (BSOL) took $128.46 million, about 68% of the total. Grayscale’s GSOL was second with roughly $28 million, and Fidelity’s FSOL added about $17.6 million. Funds from Morgan Stanley, VanEck, Franklin Templeton and 21Shares split the remaining $14 million or so.
Friday was the standout session. The funds brought in $86.67 million that day, nearly half the week’s haul, and Bitwise alone accounted for about $56 million of it.
Two details are worth keeping in mind. First, the figures are net inflows, meaning new money after redemptions. They are not trading volume, which counts shares changing hands between investors. Second, the weekly total comes from a report that doesn’t name its data provider, so it is best treated as a reported figure until fund issuers confirm it.
Bitwise still leads, but its grip loosened slightly. BSOL holds about $1.2 billion of the roughly $1.6 billion in cumulative net inflows since the category launched, a historical share near 76%. This week’s 68% suggests rival issuers are gaining ground. The fund’s staking feature, which passes yield from staked SOL to shareholders, has been a major draw, and it became the first Solana ETF to top $1 billion in assets in August.
The streak is also notable. Cumulative inflows now exceed $1.61 billion, the funds have logged twelve straight weeks of positive flows, and the past 30 days alone brought in about $447.7 million.
On-chain conditions have supported the trend. Solana’s DeFi total value locked reportedly climbed from around $4.7 billion in early August to about $6.7 billion by the end of September, and derivatives open interest sits near $7.5 billion. Traders are also watching Alpenglow, a planned consensus upgrade that aims to cut transaction finality from about 12.8 seconds to roughly 150 milliseconds. It has been moving through testing.
The price has not fully followed the flows. SOL has traded around $118 to $122 in recent sessions and slipped alongside the broader market on Monday, when bitcoin and ether both fell. ETF demand shows what institutions are buying, but it doesn’t by itself explain short-term price moves.
For now, the trend is clear. Solana has moved from a niche ETF story to a category with billions in assets, steady weekly demand and growing competition among issuers. Whether this week’s record marks a new baseline or a one-off spike will show in the next few weekly flow reports.

Tokenization platform Ondo Finance has firmly denied a report that it was pitched to prospective buyers in the wake of founder and CEO Nathan Allman’s unexpected death earlier this year.
According to people familiar with the matter, outreach to potential acquirers took place sometime after Allman died on May 25 at age 32, without a will. His unexpected passing threw the fate of his controlling stake — and a substantial holding of ONDO tokens — into legal limbo. It remains unclear exactly who initiated contact with potential buyers.
The uncertainty deepened in early August, when administrators of Allman’s estate sued Ondo’s acting CEO, Ian De Bode, accusing him of improperly seizing control of the company and its funds. That dispute triggered a heated fight over who actually runs Ondo. Following probate, Allman’s estate was awarded to his parents, Kathleen and Lawrence Allman, aged 77 and 82 respectively. A separate petition — filed by Allman’s half-sister and an Ondo investor — is also seeking to limit Kathleen Allman’s authority over her share of the estate, something she disputes.
Under the current court order, De Bode remains in the CEO seat handling day-to-day operations, but he’s barred from making major company decisions until the ownership fight is resolved — a restriction that people close to the matter say has likely stalled any real sale process regardless of who was behind the outreach.
An Ondo spokesperson pushed back hard on the sale reports, saying no one at the company sought buyers or entered sale talks, and calling the claims false. Allman’s estate declined to comment.
Founded in 2021 by former Goldman Sachs staffers, Ondo runs tokenized U.S. Treasury and stock products with more than $3.8 billion currently held across them.

Crypto exchanges wipe out roughly $571 million in bullish futures positions within 24 hours after the US Senate fails to advance the Clarity Act. Bitcoin and Ether longs absorb the bulk of the damage.
Data from CoinGlass shows Bitcoin and Ether longs losing close to $190 million each as leveraged positions get force-closed across major exchanges. Traders who bet on a positive outcome pay the price.
The Senate cloture motion on H.R. 3633 fails 49-50, falling eleven votes short of the sixty needed to close debate. The result triggers an immediate wave of selling across digital asset markets.
XRP longs lose around $30 million in the selloff, while Solana longs account for roughly $22 million in liquidations. Long positions dominate the losses, with short liquidations totaling only about $100 million.
CoinGlass figures mark the highest level of long liquidations since Aug. 22, according to data reviewed by market trackers. The numbers can shift as the rolling 24-hour window continues to update.
Futures positions get force-closed when market swings create losses large enough to push posted collateral below an exchange’s required threshold. Traders can add funds to avoid liquidation, but many fail to react in time.
Bitcoin trades near $75,834 as Wednesday’s early session gets underway, down two percent over the past day. Its 24-hour range runs from roughly $75,038 to $77,703 on trading volume close to $39.3 billion.
Ether changes hands near $2,483, slipping around 1.5 percent over the same period. The token moves between approximately $2,479 and $2,608 during the preceding day as the broader market absorbs the news.
Bitcoin had climbed from around $77,000 on Monday toward nearly $80,000 ahead of the vote as traders positioned for a favorable outcome. The rally begins reversing once cloture prospects start looking shakier.
Coinbase and Circle shares fall as much as ten percent during Tuesday’s session as the vote outcome becomes clear. Republican Senators Susan Collins, Josh Hawley, Jerry Moran and Thom Tillis vote against cloture.
The Clarity Act remains on the Senate calendar despite the failed procedural test, and lawmakers could revisit the bill later. Coinbase CEO Brian Armstrong says regulators can still advance crypto rules without new legislation.

Circle Internet, issuer of the USDC stablecoin, becomes the new principal partner and front-of-shirt sponsor of Chelsea Football Club starting this season.
The Circle and USDC brands appear across Chelsea’s men’s, women’s, and academy shirts, marking the club’s return to having a named sponsor after a three-year vacancy.
Chelsea debuts the new kit at Stamford Bridge this Sunday against Brighton and Hove Albion, the club’s first home Premier League fixture of the campaign.
Financial terms of the deal remain undisclosed. Reports earlier this year suggested Chelsea sought around sixty five million pounds annually for the sponsorship slot.
That figure converts to roughly eighty eight million dollars a year, though neither Circle nor Chelsea confirms whether the final agreement lands near that mark.
The partnership marks the first time a cryptocurrency financial services firm takes the principal shirt sponsorship of a Premier League club rather than a secondary placement.
Crypto brands previously entered English football through smaller sleeve deals. OKX sponsors Manchester City’s sleeve, while Kraken holds a similar arrangement with Tottenham Hotspur.
OKX’s sleeve agreement reportedly cost seventy million dollars per year when it launched in 2023, giving some sense of scale for crypto sports sponsorships.
Circle holds an electronic money license from the UK’s Financial Conduct Authority, a distinction the company is likely to lean on given recent regulatory scrutiny.
In June, the FCA warned Premier League clubs about partnering with unauthorized crypto firms, flagging potential breaches of financial promotion rules for unlicensed operators.
Circle frames the tie-up as a branding exercise built around global reach. Both companies describe the goal as connecting stablecoin money with a worldwide football audience.
The announcement makes no mention of Chelsea supporters using USDC to buy tickets or merchandise, so the deal appears limited to sponsorship exposure for now.
Stablecoins have pushed toward mainstream financial use throughout 2026, and this sponsorship gives Circle a highly visible platform to extend that momentum into sports marketing.
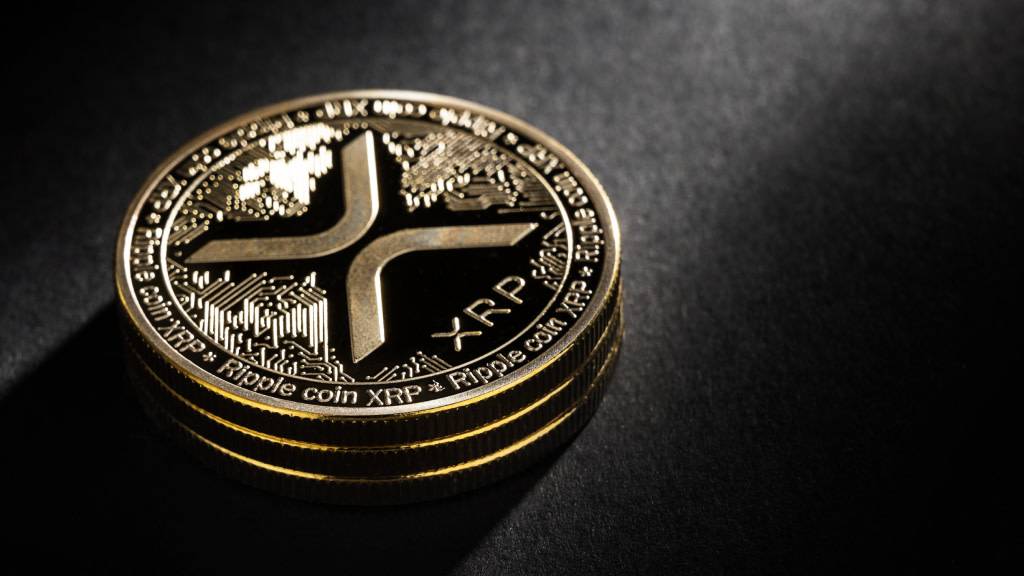
XRP surges more than 15% over 24 hours, trading near $1.15 and briefly touching $1.16, joining a broader crypto rally that also carries bitcoin above $72,000.
The move follows months of unusually large orders moving through XRP markets without producing much visible impact on the token’s price during that stretch.
New ledger data now shows roughly 23% of all XRP changing hands on the XRP Ledger occurs within a specific three-hour trading window each day.
That window spans the London afternoon and New York morning, the only stretch when both major financial centers operate simultaneously with full liquidity overlap.
A year ago, that same three-hour period accounted for only about 14% of daily XRP activity, according to data reviewed by treasury firm Evernorth.
Since the window represents just 12.5% of a full trading day, activity inside it now runs at nearly twice the rate expected from evenly spread trading.
The pattern shows up consistently across all three major ways XRP moves through the ledger, including its order book, its automated market maker pools, and cross-currency payment routing.
Every hour within the London-New York overlap now carries roughly twice the transaction volume of an average hour outside that window, ledger data confirms.
Evernorth frames the shift as consistent with growing institutional participation in XRP markets, though the firm maintains a direct financial interest in that narrative.
The company runs an active XRP treasury strategy backed by Ripple and other investors, with filings describing plans for over $1 billion in gross proceeds and a Nasdaq listing.
Public blockchain records reveal transaction timing, size, and routing details clearly, but they generally stop short of identifying which specific participants sit behind each trade.
Earlier this month, a separate report found that average XRP spot order sizes stayed within whale-level territory throughout the token’s slide from around $2.40 in January.
That earlier pattern suggested large holders were absorbing supply during the decline rather than triggering an immediate breakout, setting up the conditions for the current rally.
Retail traders and automated strategies remain fully capable of producing the same activity pattern, since crypto markets trade continuously and never formally close.
The overlap window also coincides with the heaviest period for breaking crypto news and the busiest hours for U.S. exchange retail volume, complicating any single explanation.
BitGo swung to a net loss in the second quarter even as revenue climbed sharply, the publicly listed digital asset infrastructure firm reported this week. The company posted a $19 million net loss for the quarter despite revenue surging nearly 80% year on year to $4.3 billion.
The loss marks an improvement from earlier in the year. BitGo’s net loss narrowed from $60.7 million in the first quarter, while revenue rose 14.7% quarter over quarter.
Unrealized losses on digital assets drove much of the year on year swing. An $18.8 million unrealized loss on digital assets compares against a $55.8 million unrealized gain in the same period last year.
BitGo chief executive Mike Belshe addressed the shortfall directly on the earnings call. He said Q2 performance fell short of expectations, adding that profitability was hurt by lower margins and an unfavorable revenue mix.
Belshe pointed to two specific pressure points behind the margin squeeze. He cited lower spreads on certain spot transactions along with a smaller contribution from derivatives trading.
Management is responding with cost discipline rather than just watching the numbers. BitGo authorized a share repurchase program of up to $50 million alongside cost cutting measures expected to save about $15 million annually.
Staffing cuts made earlier this year form part of that effort. The company expects expenses to decline in the third quarter following a workforce reduction of about 15% in June.
Markets reacted modestly to the mixed results. BitGo shares fell 1.8% in overnight trading to $4.90 after closing the prior session up 0.6% at $4.99.
The results land amid a broader wave of belt tightening across crypto infrastructure firms this year. Rivals have leaned on similar playbooks, pairing headcount reductions with buyback programs to reassure shareholders.
Revenue growth at that scale still stands out relative to peers, even with the bottom line under pressure. BitGo’s management is betting the cost cuts announced this year will translate into steadier margins by the fourth quarter.

BTCPay Server has confirmed that attackers exploited a critical vulnerability and successfully stole funds from users running outdated versions of the software.
The open-source, self-hosted bitcoin payment processor pushed an emergency update to version 2.4.2 to close the hole. It urged every operator to update immediately.
The flaw allowed an unauthenticated remote attacker to obtain macaroon credential files tied to LND, a widely used Lightning Network implementation.
Stolen macaroon files can hand an attacker effective control of an LND node. From there, funds can be moved directly out of the node without the owner’s involvement.
BTCPay Server said the vulnerability affects every version released before 2.4.2, including release candidates for that version.
The team confirmed plainly that users were affected and that funds were stolen. It said technical details would remain withheld temporarily so operators have time to patch before attackers can study the writeup.
Hardware wallet maker Foundation and bitcoin publication Citadel21 both reported Lightning nodes swept clean, with channels force-closed before the public warning went out.
Operators unable to update right away were told to take their BTCPay Server offline entirely. That step is meant to block unauthorized access until the patch can be applied.
The vulnerability was disclosed to BTCPay by the Bitcoin Red Team, a volunteer security group that has been auditing open-source Bitcoin infrastructure.
BTCPay Server’s own on-chain and hot wallets are not affected by this specific issue. The exposure is isolated to LND-based Lightning deployments.
Updating alone does not fully close the door for affected operators. The team also advised revoking LND macaroons and moving any funds sitting in a BTCPay-generated on-chain hot wallet as an added precaution.
The incident lands amid a broader wave of scrutiny across Bitcoin infrastructure. It follows a separate Coldcard exploit that Galaxy Research says has cost users roughly 1,719 BTC, worth close to $111 million.
Circle (CRCL) confirms its Arc blockchain moves to public mainnet on September 16, marking a major step for the stablecoin issuer’s institutional ambitions.
The company unveiled a founding validator cohort dominated by traditional finance giants rather than typical crypto infrastructure operators.
BlackRock, DTCC, Mastercard, Visa, and Standard Chartered headline the list of eleven institutions securing the network at launch.
Galaxy, Global Payments, ICE, MoneyGram, SBI Group, and Sumitomo Corporation round out the founding validator group alongside Circle itself.
Arc is currently operating on a private mainnet with more than 100 ecosystem and institutional builders already testing infrastructure.
The network is a Layer-1 blockchain that uses USDC as its native gas asset and supports EVM compatibility.
Arc also features sub-second transaction finality and an in-protocol foreign exchange engine called StableFX for institutional settlement flows.
BlackRock plans to deploy its BUIDL tokenized money market fund on Arc once the public mainnet goes live.
DTCC is preparing a deeper integration, with tokenized asset support expected to expand onto Arc from 2027 onward.
CEO Jeremy Allaire told CNBC the validator count could eventually grow to between 20 and 40 operators over time.
Allaire added that ARC token holders will eventually gain staking rights and voting power over protocol governance decisions.
The announcement landed alongside Circle’s second quarter earnings, which showed total revenue and reserve income reaching $701 million.
Net income came in at $48 million, a sharp turnaround from a $482 million loss in the same period last year.
USDC in circulation closed the quarter at $73.3 billion, up 19 percent, while on-chain transaction volume hit $14.8 trillion.
Circle’s share of the fiat-backed stablecoin market slipped to 27 percent even as absolute volumes climbed sharply higher.
Arc’s testnet has already processed more than half a billion transactions across nearly three million individual wallets.
Circle also confirmed its USDC distribution agreement with Coinbase (COIN) has renewed on existing terms heading into the mainnet launch.
The validator model is built around institutions actively building on Arc rather than relying on independent node operators.
Circle says this structure is designed to satisfy the operational and compliance standards expected of financial market infrastructure.
The company plans to introduce AI developer tools and a composable application framework alongside the September mainnet launch.
Analysts see the validator lineup as a signal of deepening institutional comfort with permissioned blockchain settlement rails.
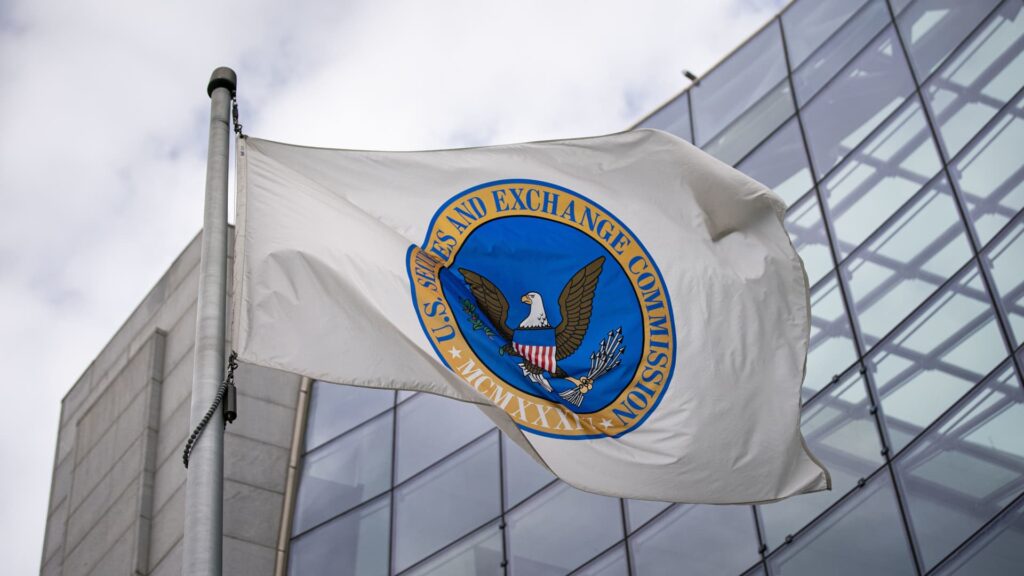
The SEC has suspended its approval of Nasdaq’s cash-settled bitcoin index options — ticker QBTC — putting the product on hold while it reviews a jurisdictional challenge from rival exchange operator CME Group.
Nasdaq’s Phlx exchange had won conditional SEC approval for the options in May on an expedited basis, with contracts designed to track the Nasdaq Bitcoin Index, itself derived from the CME CF Bitcoin Real Time Index. CME filed a formal challenge in mid-June, arguing that because bitcoin is legally treated as a commodity, any options tied to its value should fall under the Commodity Futures Trading Commission’s exclusive authority rather than the SEC’s. The full SEC commission has now granted CME’s petition for review, staying the earlier approval and opening a public comment period running through August 24.
CME’s position centers on the fact that it already operates its own regulated bitcoin futures and options markets, and that allowing Nasdaq’s product to launch without registering under the CFTC framework governing CME would let a securities exchange compete for the same order flow while sidestepping commodities oversight. The petition also flagged a broader concern: that letting the approval stand could set precedent for securities exchanges to list derivatives on other commodities more generally.
If CME’s argument prevails, Nasdaq would either need to register QBTC under CFTC rules or redesign the contracts entirely to reference a security, such as a spot bitcoin ETF, instead of the commodity itself. Until the commission rules, the product remains shelved — another sign of how listed bitcoin derivatives increasingly sit at the boundary between the SEC’s and CFTC’s overlapping authority.

MicroStrategy, now rebranded as Strategy, has introduced a new framework for measuring its bitcoin holdings that offers common shareholders greater transparency into net exposure.
The overhaul comes as bitcoin continues to face sustained selling pressure, with the broader crypto market navigating a prolonged bear cycle in 2026.
Executive Chairman Michael Saylor and his team developed the revised metrics to account for obligations tied to preferred stock and convertible debt instruments.
The new framework strips out those financial obligations before presenting bitcoin exposure figures, giving ordinary shareholders a more accurate picture of what they actually hold.
Strategy has become the largest corporate holder of bitcoin in the world, making the accuracy of its reporting metrics a matter of significant investor interest.
Previous measurement approaches did not clearly reflect how preferred stock and convertible debt diluted the effective bitcoin exposure available to common shareholders.
The revised metrics are designed to cut through that complexity and present a cleaner, more honest accounting of net bitcoin value per common share.
This kind of transparency push is particularly important during bear market conditions, when investor confidence in bitcoin treasury strategies faces its toughest tests.
Strategy’s stock has historically moved in close correlation with bitcoin prices, meaning common shareholders feel the full weight of any extended market downturn.
By reframing how bitcoin exposure is calculated and communicated, Saylor and his team are attempting to reinforce long-term conviction among the company’s retail and institutional investor base.
The move also signals that Strategy is evolving its financial communication practices as its capital structure grows more complex with each successive debt and equity raise.
Analysts have noted that as Strategy layers on more preferred offerings and convertible notes, the gap between gross bitcoin holdings and net shareholder exposure becomes increasingly meaningful.
Providing a clearer metric helps investors avoid overestimating the common shareholder’s actual claim on the company’s bitcoin reserves after senior obligations are satisfied.
Strategy holds hundreds of thousands of bitcoin on its balance sheet, a position built aggressively over several years under Saylor’s direction.
The company continues to signal that it views bitcoin as its primary treasury reserve asset and has no intention of unwinding that position regardless of short-term price volatility.