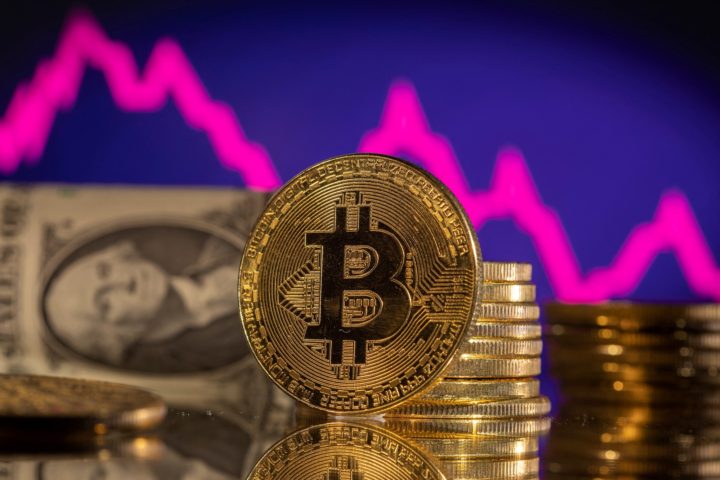

Spot Bitcoin exchange-traded funds experienced heavy withdrawals during Christmas week, with investors pulling hundreds of millions of dollars from US-listed products despite relatively stable Bitcoin prices.
Data shows that a combined $782 million flowed out of spot Bitcoin ETFs over the holiday period, marking one of the most pronounced short-term pullbacks since the products launched earlier this year.
The largest single-day outflow occurred on Friday, when ETFs tracking Bitcoin recorded $276 million in net redemptions.
BlackRock’s IBIT led the declines, with nearly $193 million leaving the fund in one session, while Fidelity’s FBTC saw $74 million in outflows.
Grayscale’s GBTC continued its longer-running pattern of smaller but persistent redemptions during the same period.
As a result, total net assets held across US spot Bitcoin ETFs fell to approximately $113.5 billion by the end of the week, down from levels above $120 billion earlier in December.
This decline occurred even as Bitcoin traded near the $87,000 level, showing little immediate price reaction to the ETF withdrawals.
Longest outflow streak since autumn
Friday’s withdrawals extended a negative trend that has now lasted six consecutive trading days, making it the longest stretch of ETF outflows since early autumn.
Across that six-day window, cumulative net outflows exceeded $1.1 billion, highlighting a clear pause in institutional inflows after months of strong demand.
Market participants note that holiday periods often exaggerate flow data due to thinner liquidity and reduced trading desks.
Vincent Liu, chief investment officer at Kronos Research, said the Christmas timing was a key factor behind the recent moves.
“As desks return in early January, institutional flows typically re-engage and normalize,” Liu said.
He added that Bitcoin ETF outflows during late December should not be interpreted as a structural shift in demand.
Expectations turn toward January and beyond
Looking ahead, Liu expects conditions to improve as institutions return from the holidays and capital allocation patterns reset for the new year.
He also pointed to macroeconomic factors that could become supportive for crypto-linked investment products.
“Rates markets are already pricing ~75–100 bps of cuts, pointing to easing momentum. Next, bank-led crypto infrastructure keeps scaling, reducing friction for large allocators,” Liu said.
Despite that optimism, some analysts see the recent data as part of a broader cooling trend.
Glassnode has reported that both Bitcoin and Ether ETFs have entered a sustained phase of net outflows, with the 30-day moving average of flows remaining negative since early November.
Because ETFs are widely viewed as a proxy for institutional sentiment, prolonged withdrawals may signal a period of reduced appetite for crypto exposure as overall market liquidity tightens.

Stani Kulechov, founder and chief executive of Aave Labs, has rejected allegations that he attempted to sway a controversial governance vote by purchasing large amounts of Aave tokens.
The claims emerged after reports that Kulechov had bought approximately $15 million worth of AAVE tokens shortly before a community proposal failed to pass.
“These tokens were not used to vote on the recent proposal, and that was never my intention. This is my life’s work, and I am putting my own capital behind my conviction,” Kulechov said.
Governance Concerns and Community Backlash
Members of the Aave community accused Kulechov of increasing his voting power to favor Aave Labs in a vote involving control of brand assets.
The proposal sought to bring Aave’s intellectual property under the control of the Aave decentralized autonomous organization, which governs the protocol.
More than 55% of participants voted against the proposal, while over 41% abstained and only 3.5% voted in favor.
Even before voting concluded, criticism mounted that the proposal had been rushed and bypassed standard governance processes.
Fees Dispute Sparks Controversy
The debate intensified after a DAO member known as EzR3aL raised concerns about fees generated through a recent integration with decentralized exchange aggregator CoW Swap.
According to the claim, those fees were directed to a wallet controlled by Aave Labs rather than the DAO.
EzR3aL argued that such fees belong to the DAO and should not have been redirected without community approval.
The issue quickly escalated into broader concerns about transparency and alignment between Aave Labs and token holders.
Communication Gaps Acknowledged
Kulechov acknowledged shortcomings in how Aave Labs has communicated its relationship with the DAO.
He said the company has not clearly explained how its products generate value for AAVE token holders.
“In the future, we’ll be more explicit about how products built by Aave Labs create value for the DAO and AAVE token holders,” he added.
Disputed Authorship of Proposal
The proposal was listed under the name of Ernesto Boado, a former chief technical officer at Aave Labs.
Boado later stated that the submission was made without his knowledge or consent.
He said he would not have approved the proposal had he been consulted prior to its publication.
The episode has renewed debate within the Aave ecosystem about governance safeguards and the separation between builders and token holders.

Social sentiment surrounding XRP has dropped sharply, falling into what analysts describe as the “fear zone,” a condition that has historically preceded notable price rebounds.
The shift in mood comes as the token continues to trade well below recent highs, despite signs of resilience from institutional investors.
Negative sentiment reaches extreme levels
Market intelligence firm Santiment said social media commentary around XRP has turned unusually pessimistic.
“XRP is seeing far more negative social media commentary than average,” the firm noted, adding that this increases the likelihood of a “strong price rebound.”
Historical data suggests similar sentiment extremes have coincided with rallies.
The last two instances of comparable fear occurred in late November and early December, when XRP went on to rally 22% and 11% respectively over the following days.
“Historically, this setup leads to price rises,” Santiment said.
“When retail has doubts about a coin’s ability to rise, the rise becomes significantly more likely.”
Price action remains under pressure
Despite the potential contrarian signal, XRP has struggled to regain upward momentum.
The token slipped nearly 2% over the past 24 hours, trading below $1.85.
That leaves XRP down almost 50% from its seven-year high of $3.66.
Still, several analysts argue the pullback does not necessarily signal deeper weakness.
“XRP sentiment is ugly again. But the money doesn’t look scared,” said analyst DefiPeniel, pointing to steady inflows into recently launched spot ETFs.
Institutional flows support long-term confidence
According to DefiPeniel, institutional participation paints a very different picture from retail sentiment.
“These investment products have seen a perfect streak of inflows since launch,” he said, noting that assets under management have climbed beyond $1.2 billion.
The contrast between muted price action and sustained capital inflows suggests longer-term confidence remains intact.
“Markets don’t bottom when vibes improve,” DefiPeniel added.
“They bottom when price holds and sentiment breaks.”
Key resistance levels dominate the chart
From a technical perspective, XRP faces several hurdles before a sustained recovery can take shape.
The price must first break above a multi-month descending trendline near $1.92 and hold it as support.
Beyond that, heavy resistance lies between $1.96 and $2.00, an area where investors accumulated roughly $1.5 billion worth of XRP.
A daily close above $2 would open the path toward a move into the $2.10 to $2.50 range.
That zone contains multiple major moving averages, including the 50-day SMA, 50-week EMA and 50-week SMA.
Downtrend risks remain
Not all analysts are convinced a turnaround is imminent.
XRP remains “still in a strong downtrend,” according to trader C3_trading.
The analyst noted repeated rejections between $2.50 and $2.70 and said a decisive breakout is needed to change the broader trend.
“Wait for a breakout above $2.50 for trend shift, otherwise expect continuation lower,” he said.
On the downside, a failure to hold above $1.80 could expose XRP to a retest of $1.75 and potentially the April low near $1.61.
A break below that level would significantly raise the risk of a deeper slide toward $1.25 and even $1.00 in 2026.

Bitcoin (BTC) circled the $88,000 mark on Sunday amid anticipation of renewed volatility into the weekly close.
Market participants remain divided on short-term BTC price movements.
While some forecasts predict six-figure prices, others are preparing for a potential retreat toward $70,000.
Analysts cite rising Binance inflows as a factor that could weigh on BTC’s price.
Traders Anticipate Bullish Moves
Data from Cointelegraph Markets and TradingView showed BTC/USD trading within a $5,000 range for its eighth consecutive day.
The trading community increasingly expects a breakout.
“$BTC relief rally could happen soon,” crypto analyst Ted Pillows wrote on X.
He predicted a pump toward the $98,000–$100,000 range before the next potential downturn.
Pillows highlighted the importance of buyer pressure to prevent the 100-week exponential moving average from falling below its simple moving average.
“The last 2 instances caused a 40%-50% $BTC crash within 4-6 weeks,” he warned.
Trader Captain Faibik echoed bullish sentiment, predicting a near-term breakout followed by a surge in FOMO-driven entries.
“In next few days, Bitcoin will breakout & then everyone will rush in with FOMO entries which won’t be beneficial,” he said.
Another trader, Korinek_Trades, projected fresh all-time highs, but noted a possible macro-level low could come first.
“We should still see another higher high for blue W5 up to ATH complete a 5 wave structure,” they wrote, using Elliott Wave theory to forecast BTC’s next moves.
- Upside target: $150,000 in the medium term.
- Short-term observation: Price stuck below $90,000, awaiting breakout.
Risks of a Return to $70,000
CryptoQuant highlighted the possibility of BTC revisiting prior highs near $70,000.
Bitcoin remains “fragile” and could drop toward strong buyer zones.
“The next major downside target lies at the high-demand zone between $70,000 and $72,000, where stronger buyer interest is expected to emerge,” CryptoOnchain noted.
Rising BTC inflows to Binance add to downside risk.
“The combination of a technical breakdown below $90K and the injection of $1.4B worth of BTC into Binance significantly increases the probability of a corrective move toward the $70K–$72K demand zone,” the analysis concluded.

Bitcoin is under pressure as macro analysts warn that an expected interest rate hike by the Bank of Japan on December 19 could trigger a deeper correction toward the 70,000 dollar level.
Several analysts say past market reactions suggest Bitcoin is vulnerable when Japanese monetary policy tightens.
The core concern centers on liquidity.
When the Bank of Japan raises rates, global borrowing costs increase, the yen strengthens and carry trades unwind.
This combination has historically weighed on risk assets, including Bitcoin.
Previous BOJ Hikes Triggered Steep Market Pullbacks
Data from analyst AndrewBTC shows that every BOJ rate hike since 2024 coincided with significant declines in Bitcoin.
The asset fell by around 23% in March 2024, 26% in July 2024 and 31% in January 2025 following policy tightening announcements.
The analyst argues that similar conditions are emerging again as the central bank signals another interest rate increase.
Economists in a recent survey overwhelmingly expect the BOJ to move ahead with tightening this month.
The dynamics behind these declines stem from Japan’s role in global liquidity flows.
When Japanese rates rise, borrowing becomes more expensive and leveraged investors often unwind positions built on cheap yen financing.
Such periods generally trigger risk-off sentiment across global markets.
Bitcoin, widely held through leverage across derivatives platforms, tends to be sensitive to liquidity shocks.
Analyst EX said BTC will “dump below $70,000” if macro conditions develop as expected.
His outlook aligns with others who see Bitcoin’s recent weakness as part of a broader liquidity-driven repricing.
Technical Signals Also Point Toward a $70,000 Target
Chart analysts note that Bitcoin is currently trading inside a bear flag pattern.
The structure formed after Bitcoin’s sharp drop from the 105,000 to 110,000 dollar zone earlier in the year, followed by a narrow upward drift.
Bear flags usually indicate a pause before the prevailing downtrend continues.
A breakdown below the lower trendline could push Bitcoin toward the 70,000 to 72,500 dollar region.
Multiple analysts, including James Check and Sellén, have outlined similar targets over the past month.
They argue that technical and macro factors are overlapping at a time when liquidity is tightening worldwide.
The convergence of patterns has made traders increasingly cautious.
Many see the coming BOJ decision as a potential trigger for a sharp move.
Bitcoin’s Short-Term Outlook Remains Fragile
Analysts say market sentiment has weakened significantly since Bitcoin failed to reclaim the 105,000 dollar level earlier in the year.
Each rebound attempt has met strong selling pressure.
With liquidity thinning and macro uncertainty rising, traders are watching whether Bitcoin can hold current support levels.
A decisive break could open the door to deeper retracement.
For now, the dominant view is that Bitcoin is exposed if the BOJ raises rates again.
Japan’s monetary decisions have become an unusually important driver for global risk assets.
Bitcoin’s path will depend on whether macro tightening continues and whether buyers return with enough strength to absorb the next wave of selling.
Until then, analysts see elevated downside risk and limited signs of bullish momentum.

Fresh concerns about Tether’s financial health surfaced this week after comments from BitMEX co-founder Arthur Hayes suggested the stablecoin issuer could face serious pressure if the value of key reserve assets were to fall.
Tether, which issues the market-leading USDT stablecoin, has faced repeated scrutiny over the composition and transparency of its reserve holdings.
Hayes reignited the debate by arguing that the company is increasingly exposed to volatile positions that could undermine its ability to maintain a 1:1 dollar peg.
Hayes Says Decline in Bitcoin and Gold Could “Wipe Out” Equity Buffer
In recent commentary, Hayes said Tether is “in the early innings of running a massive interest-rate trade.”
He warned that a 30% decline in the value of the company’s Bitcoin and gold holdings could eliminate its equity cushion.
Tether has significantly expanded its exposure to gold over the past several years, alongside an increase in Bitcoin holdings.
Hayes argued that while Tether currently earns substantial income from interest-bearing assets, this strategy increases vulnerability if markets turn sharply lower.
He concluded that in a severe downturn, USDT could become “technically insolvent.”
CoinShares Research Head Pushes Back
James Butterfill, head of research at digital-asset firm CoinShares, disputed Hayes’s analysis in a market update issued on Dec. 5.
He said concerns about Tether’s solvency “look misplaced,” pointing to the company’s latest attestation covering the third quarter of 2025.
According to that report, Tether held $181 billion in total reserves against approximately $174.45 billion in liabilities.
This left a surplus of nearly $6.8 billion.
Butterfill argued that the data show no immediate systemic risk, although he emphasised that stablecoin issuers should always be monitored cautiously due to their role in broader market liquidity.
Ongoing Debate Over Reserve Quality
Tether remains one of the cryptocurrency sector’s most profitable companies.
It generated an estimated $10 billion in profit during the first three quarters of 2025 — an unusually high figure considering its relatively small workforce.
However, the firm continues to face criticism regarding the composition of its reserves.
S&P Global recently downgraded USDT’s ability to defend its dollar peg, citing exposure to “higher-risk” assets such as gold, loans and Bitcoin.
Tether CEO Paolo Ardoino dismissed the downgrade as “Tether FUD,” arguing that the company’s financial statements show its position remains strong.
He pointed to the firm’s attestation as evidence of adequate liquidity and responsible asset management.
Market Position Remains Dominant
Despite recurring concerns, USDT continues to be the largest stablecoin in the world.
The token has approximately $185.5 billion in circulation.
It also controls nearly 59% of the global stablecoin market.
Tether maintains a substantial allocation to U.S. Treasuries — estimated at more than $130 billion — which remains its most stable reserve component.
However, the increasing share of Bitcoin and gold exposes the company to greater price swings, keeping the debate alive among analysts and regulators.
The long-running dispute over Tether’s reserve practices is unlikely to subside soon, particularly as stablecoins continue to serve as a key pillar of global cryptocurrency trading.
Bitcoin is showing an unusually strong resemblance to its 2022 bear-market behavior, with analysts noting that the price pattern in 2025 is aligning almost perfectly with previous cycle lows.
With the year nearing its end, the cryptocurrency remains down around 36% from its all-time high despite earlier expectations that bullish momentum would accelerate into December.
Network economist Timothy Peterson has been among the most vocal in highlighting how closely the current trajectory matches that of 2022.
“2H2025 Bitcoin is the same as 2H2022 Bitcoin,” he wrote in a recent post on X.
Correlation Metrics Reach Unprecedented Levels
Peterson’s analysis shows that the daily correlation between 2025 and 2022 market action sits at roughly 80%.
The monthly correlation has climbed even higher, hitting an extraordinary 98%.
Charts accompanying his research indicate that if the trend remains intact, Bitcoin may not see a significant rebound until sometime in the first quarter of 2026.
These findings have unsettled investors who hoped the market would rebound heading into the holiday period.
Peterson recently summarized November’s performance with blunt clarity.
“It feels bad because it is bad,” he wrote, adding that “this month ranks in the bottom 10% of daily price paths since 2015.”
Historical Patterns Suggest December May Bring More Losses
Bitcoin’s negative performance in November has historical implications.
Data shows that when the cryptocurrency posts a “red” November, December often follows with further declines, though usually with reduced severity.
With only weeks remaining in the year, traders are now weighing whether macro-driven optimism could deliver an end-of-year “Santa rally” or whether the market will continue mimicking 2022’s prolonged slump.
Shift in Macro Environment Boosts Equities
While crypto endured a challenging month, broader financial markets have shown signs of recovery.
Figures reported by The Kobeissi Letter indicate that US equity funds have witnessed $900 billion in inflows since November 2024, with $450 billion arriving within the last five months alone.
The publication noted: “Put differently, equities have attracted more inflows than all other asset classes COMBINED.
Equity inflows remain remarkably strong.”
This surge contrasts with the relatively muted performance of other asset classes, creating a divergence between stock-market sentiment and crypto-market behavior.
ETF Inflows Signal Potential Crypto Stabilization
Despite the recent sell-off, new data suggests that institutional crypto participation may be recovering.
Spot Bitcoin ETFs recorded $220 billion in inflows during Thanksgiving week, a noteworthy improvement after weeks of consistent redemptions.
Spot Ether ETFs saw a similar turnaround, adding $312 million over the same period.
These inflows may indicate that institutional investors are positioning ahead of a possible early-2026 recovery.
Crypto-linked stocks saw strong upward movement on Friday as traders reacted to a sharp rise in prediction-market forecasts pointing to a December interest-rate cut.
The odds listed on Polymarket rose to 87% — the highest level recorded this month — and that shift in expectations drove renewed appetite for crypto-exposed equities.
Several U.S.-listed Bitcoin miners led the day’s advance.
Cleanspark, Riot Platforms and Cipher Mining each recorded gains during Friday’s session, adding to a streak of double-digit increases over the previous five days.
Circle, the issuer of USDC, also made notable progress with nearly a 10% jump in early trading.
Strategy, backed by Michael Saylor, alongside Coinbase, logged more modest increases but still participated in the broader market move.
Bitcoin itself added around 7% over the past week after briefly dipping to roughly $82,000 on Nov. 21.
Interest-Rate Commentary Drives Market Volatility
The rapid swings in prediction-market pricing throughout November have largely been tied to comments from Federal Reserve officials.
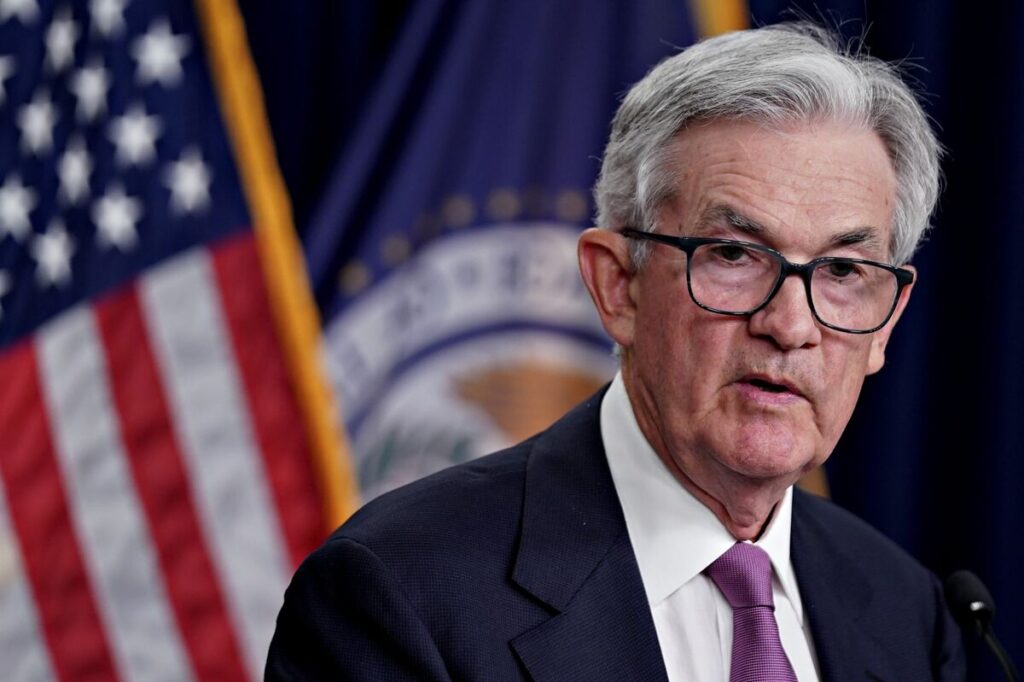
On Oct. 29, Fed Chair Jerome Powell stated that a December rate cut was “not a foregone conclusion,” which investors interpreted as a hawkish signal.
That single remark led to prediction-market odds collapsing from 89% the previous day to around 22% by Nov. 20.
The sentiment reversal began on Nov. 17 after Fed Governor Christopher Waller indicated the central bank should actively consider a rate cut next month.
He argued that “the labor market is still weak and near stall speed” and that inflation appeared “relatively close” to the Fed’s 2% target.
The remarks immediately reshaped expectations and helped drive the latest price rally in crypto-linked assets.
Prediction Markets Gain Influence Across Industries
Prediction markets have expanded significantly this year as more companies and investors embrace the model.
Platforms such as Polymarket and Kalshi have attracted users by allowing wagers on political developments, financial outcomes and major global events.
Polymarket recently secured a multi-year partnership to act as the official prediction-market platform for both the UFC and Zuffa Boxing.
The company has also grown through other strategic partnerships that broaden the use of prediction contracts across entertainment and sports.
Meanwhile, Kalshi has continued its own expansion after attracting major investment rounds that substantially increased its valuation.
Both platforms have reported surging user activity as traders increasingly use prediction markets to anticipate economic decisions, including those from the Federal Reserve.
Trading Apps Join the Prediction-Market Trend
The rapid rise of prediction markets has also caught the attention of larger trading platforms.
Robinhood recently confirmed that prediction markets have become one of its fastest-growing revenue categories.
The platform said that more than one million users have already traded billions of contracts since the feature launched earlier this year.
Rumors have also circulated that Coinbase is developing a prediction-market platform of its own, following the appearance of early interface images.
The acceleration of these platforms underscores a broader trend: traders across traditional and crypto markets are relying more heavily on probabilistic pricing tools to interpret and react to policy shifts.
As expectations for a December rate cut climb, crypto-linked stocks appear positioned to remain sensitive to any new signals from the Federal Reserve.

Bitcoin held its ground above the $90,000 support level on Thursday, benefiting from a pause in US trading activity during the Thanksgiving holiday and sparking fresh optimism that a more sustained recovery may be forming.
Data from market tracking platforms showed BTC/USD stabilizing after hitting weekly highs near $92,000 earlier in the day.
The lack of a Wall Street session removed short-term selling pressure, offering bulls a temporary window of relief.
Traders said attention now turns to the critical resistance zone near the 2025 yearly opening price at just over $93,000.
Crypto analyst Michaël van de Poppe described the area as a pivotal barrier that could determine Bitcoin’s next major move.
“If this levels breaks, Bitcoin is back up to $100K,” he wrote on X.
He added that the latest upswing represented “a pretty strong bounce upwards,” but cautioned he wanted to see “some consolidation” before a decisive breakout attempt.
Market liquidity indicators suggest that a substantial cluster of resting orders sits between $97,000 and $98,000.
Trader Daan Crypto Trades identified this zone as a key near-term upside target, noting that heavy sell-offs from earlier in the month created a “big liquidity pocket” at that level.
He pointed out that the region also aligns with a horizontal price structure that could attract both short-covering and breakout buyers.
Some traders maintain that a retest of $88,000 would not be unexpected, with van de Poppe saying he “wouldn’t mind” such a move and arguing that the broader crypto bull cycle remains “far from over.”
On-chain indicators show improving conditions underneath the surface.
J. A. Maartunn, a contributor to analytics platform CryptoQuant, reported that spot taker cumulative volume delta — a measure that has hovered in negative territory — has recently moved back toward neutral.
He described the shift as a “significant step forward” for market recovery.
Earlier this month, analysts highlighted the negative trend in spot taker CVD as one of several risk factors as Bitcoin traded above $100,000.
CryptoQuant researchers now argue that data across spot, futures, and on-chain markets reflects the unwinding of what they termed a “leveraged phase.”
In a recent analysis, XWIN Research Japan wrote that the market is showing signs of longer-term capital returning, citing a retail futures activity indicator that has flipped green and historically aligns with key market turning points.
The current stabilization comes after a volatile stretch for Bitcoin.
Earlier in November, the market wrestled with heavy selling and rapid liquidations tied to broader macro uncertainty and rising geopolitical tensions.
Despite that turbulence, Bitcoin’s ability to hold $90,000 suggests buyers are actively defending strategic levels as the year heads into its final weeks.
With holiday-related lower volumes and upcoming macro events likely to influence market direction, traders say Bitcoin’s next moves could define the opening narrative for 2026.
For now, the return of bullish sentiment, improving liquidity conditions, and on-chain stabilization are raising hopes that the recent rebound may be more than a temporary pause.
Bitcoin (BTC) has begun a steady recovery after last week’s steep correction, moving back toward the $87,000 to $90,000 range.
The cryptocurrency fell from $106,000 to $80,600 in just 10 days, prompting renewed speculation over whether BTC has reached a local bottom.
The rebound comes even as major whale holders continue to sell their BTC, though mid-sized holders and long-term accumulators are showing increased conviction in the market.
Accumulation and Distribution Patterns
Onchain analytics reveal significant differences in behavior between various BTC holder cohorts.
Wallets holding more than 10,000 BTC, along with institutional investors holding 1,000 to 10,000 BTC, acted as consistent sellers during the correction, contributing to downward pressure.
Retail wallets, defined as holding less than 10 BTC, also sold off over the past 60 days, providing little market support.
In contrast, mid-sized holders in the 10–100 BTC and 100–1,000 BTC ranges accumulated BTC, helping absorb sell-side pressure and stabilize prices.
Demand from Bitcoin “accumulator addresses” hit a record 365,000 BTC on Nov. 23, up from 254,000 BTC on Nov. 1, indicating growing long-term confidence among certain investors.
Futures Market and Short Squeeze Potential
The recent BTC crash was largely fueled by futures markets, where cascading long liquidations, forced selling, and margin calls pushed BTC into the $80,000 range.
CryptoQuant data shows that traders attempting to long the correction have been squeezed out, with daily funding rates briefly turning negative.
Analyst Darkfost warned that if shorts continue to pile up while BTC gradually rises, the market could enter a “disbelief phase,” creating the conditions for a sharp short squeeze.
Long liquidation heatmaps from Hyblock Capital indicate $2.6 billion in long liquidations at $80,000, while short liquidations surged over $8.4 billion near $98,000, showing the influence of liquidity bands at $94,000, $98,000, and $110,000.
These dynamics suggest that BTC’s rebound may continue toward the $90,000 mark as mid-sized holders and accumulators provide steady support.