

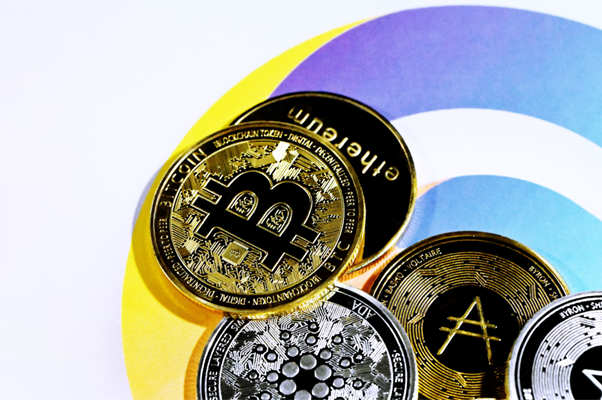
XRP’s price remained relatively unchanged on Tuesday, registering a marginal 0.1% decline over the past 24 hours and trading at $2.26.
Although momentum appears stagnant on the surface, technical analysts suggest a potential bullish breakout may be forming if key resistance levels are breached.
Traders are closely watching the $2.20–$2.30 range, which holds both the 50-day simple moving average (SMA) at $2.22 and the 100-day SMA at $2.20.
A daily close above this range would be the first major hurdle for bulls.
Further up, XRP must flip the 200-day SMA at $2.36 into support to pave the way for a rally toward $3 and beyond.
Historical Pattern Points to Potential Rally
Historically, XRP has demonstrated strong rallies after reclaiming the 200-day SMA.
In November 2024, the XRP/USD pair crossed above this level, triggering a significant price surge of over 430%, peaking at $2.90 by December 3, 2024.
This historical trend reinforces optimism among market participants expecting another upward move.
Analysts Signal Strengthening Momentum
Crypto analyst CasiTrades took to X on Monday to highlight a bullish continuation setup forming on the daily chart.
“The momentum is building, and XRP’s breakout is close,” the analyst wrote.
CasiTrades pointed to the convergence of the multimonth trendline apex with the 50- and 100-day SMAs around $2.25, noting this as a key support level.
“We’re now sitting just below $2.30, our local resistance. Once this level breaks, the next likely targets are $2.69 and $3.04.”
In a similar analysis, pseudonymous trader Dom emphasized that XRP had moved above a crucial breakout zone near $2.25.
He noted that the area includes all major Volume Weighted Average Prices (VWAPs) and the 160-day downtrend line.
“This is the exact momentum bulls need to aggressively show up and it can send [XRP] to $2.40s,” Dom stated.
XRP/BTC Pair Shows Bullish Divergence
Beyond USD trading, XRP is also displaying strength against Bitcoin.
Over the weekend, the XRP/BTC pair broke above a multimonth descending trendline at 0.00002065 BTC.
This trendline had acted as resistance since March.
A successful retest of this level could confirm a shift in trend, potentially leading to more gains for XRP relative to Bitcoin.
Technical indicators further support the bullish outlook.
Between May and July, the XRP/BTC pair formed lower lows while its daily Relative Strength Index (RSI) climbed from 28 to 55—creating a bullish divergence.
This divergence suggests waning selling pressure and renewed investor interest.
Upside Confirmation Nearing
Market analyst Mikybull Crypto believes that XRP’s next major test lies at the 0.000022 BTC resistance level.
“Break this trendline resistance and XRP will rally strong,” the analyst said.
Analysts also noted that a breakout from the symmetrical triangle pattern on the XRP/BTC chart could trigger gains of up to 70%.
Such a rally would almost certainly propel XRP’s price above $3, echoing historical price behavior.
Cryptocurrency investment vehicles continued to attract significant capital last week, even as the broader market faced price swings.
CoinShares reported $1.04 billion in inflows into crypto exchange-traded products (ETPs) for the week ending Friday.
Bitcoin Still Dominates, But Interest in Ether Grows
Bitcoin-related ETPs led the inflows, attracting $790 million, which represents 76% of the weekly total.
While this is a strong showing, it marks a slowdown from the previous three weeks, where average weekly inflows hit $1.5 billion.
CoinShares’ James Butterfill noted the decline may indicate investor caution as Bitcoin approaches its all-time high.
Ethereum-related products also saw sustained interest, with $225 million in inflows.
That makes it 11 consecutive weeks of gains for Ether ETPs.
Butterfill highlighted that weekly inflows during this run averaged 1.6% of AUM—twice the rate of Bitcoin’s 0.8%—suggesting a shift in investor sentiment.
BlackRock and the U.S. Lead the Charge
BlackRock was the top issuer last week, attracting $436 million in new funds, or 42% of the total inflows.
Regionally, the U.S. led with $1 billion in inflows, followed by Germany and Switzerland with $38.5 million and $33.7 million, respectively.
XRP has entered a potential correction phase as its Stochastic RSI remains in overbought territory.
The indicator, which measures momentum relative to recent range, has stayed above 80 on XRP’s daily chart since June 28.
Past instances in 2025 show similar setups have led to 12% to 45% price drops, averaging a 25% decline.
With the same pattern forming in July, analysts anticipate a near-term pullback.
Descending Triangle Adds to Downside Risk
XRP’s current chart structure suggests further pressure.
A descending triangle pattern has formed following XRP’s previous upward trend, with bearish projections placing support near $1.14.
This marks a potential 50% drop from current levels.
Crypto analyst Xanrox warns of a deeper correction tied to a multi-year ascending triangle dating back to 2017.
He points to a Fair Value Gap (FVG) created during XRP’s early 2025 rally, noting that such gaps are often revisited after sharp gains.
Extreme Bearish Projection Targets $0.60
Xanrox believes XRP could retrace toward the triangle’s lower trendline at $0.60, suggesting a 70% drawdown from present prices.
This prediction follows XRP’s 2025 peak near $3.40.
However, not all analysts are pessimistic.
Mikybull Crypto envisions a symmetrical triangle setup targeting $3.70 by September, while XForceGlobal projects a range between $8 and $27 based on Fibonacci analysis.
Other bullish arguments cite whale accumulation and a falling wedge breakout with upside targets near $3.20.
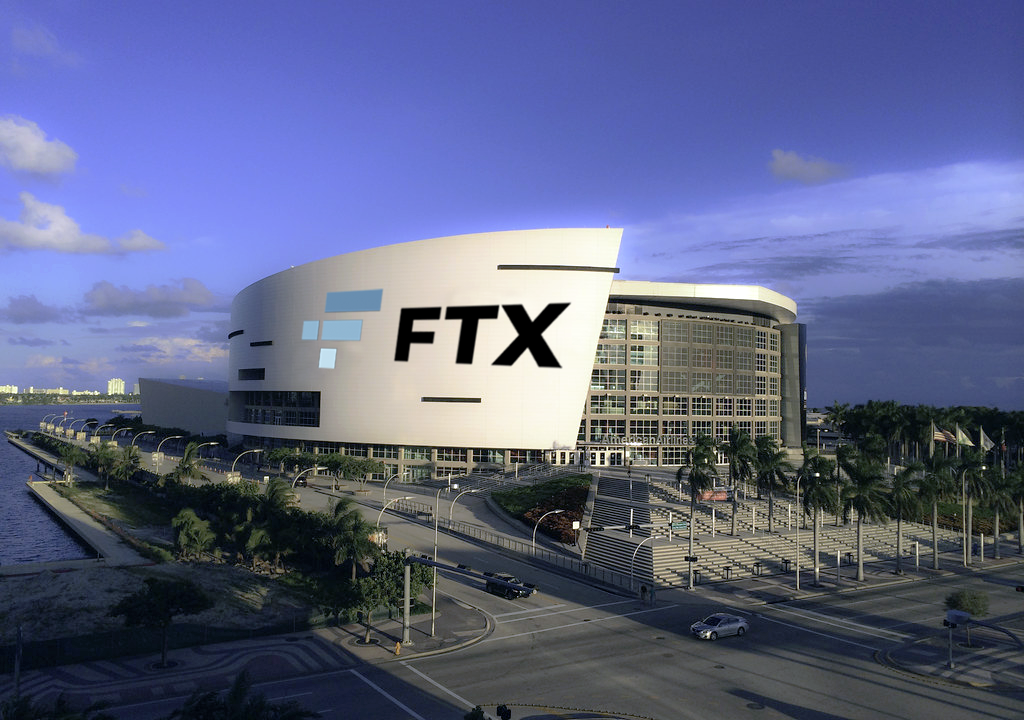
FTX’s bankruptcy estate has asked the U.S. Bankruptcy Court for permission to freeze crypto distributions to creditors in 49 countries with unclear or restrictive regulations.
The request, submitted Wednesday in Delaware, is aimed at avoiding potential legal penalties from violating cross-border digital asset laws.
“Distributions made by or on behalf of the FTX Recovery Trust into jurisdictions in violation of these legal restrictions may trigger fines and penalties, including personal liability for directors and officers, and/or criminal penalties up to and including imprisonment,” the estate warned.
China and Russia Among Targeted Jurisdictions
FTX’s creditor base spans the globe, but the estate has cited nations with prohibitive or undefined crypto laws as high risk.
These include China, Russia, Iran, Saudi Arabia, Egypt, and Ukraine, among others.
The estate said, for example, that institutions in Macau are barred by mainland authorities from engaging in virtual currency services.
The estate emphasized that all 49 identified jurisdictions are affected by similarly stringent regulations.
Distributions on Hold, Not Cancelled
While not rejecting payouts altogether, the estate clarified that it is placing distributions on hold pending legal clarity.
This delay includes the majority of claims originating from China, which represent 82% of the affected value.
Though China has banned crypto transactions, it hasn’t fully prohibited the possession of digital assets, creating ambiguity.
Meanwhile, nearby Hong Kong has taken a supportive stance toward crypto, recently endorsing investment products like ETFs and derivatives.
FTX’s legal team is pushing for a clear framework: “The FTX Recovery Trust has developed the restricted jurisdiction procedures to provide notice and a process for resolving the question of whether distributions will be made pursuant to the plan.”
The motion seeks court approval to proceed cautiously, allowing some distributions to resume once jurisdictional clarity is achieved.
Legal experts have voiced understanding of the strategy.
“It doesn’t surprise me that the FTX estate might not make distributions in countries where such distributions might be illegal,” said Aaron Brogan, managing attorney at Brogan Law.
Crypto analyst Rekt Capital believes Bitcoin’s current bull market could be nearing its end, predicting that a price peak may come as early as October.
“We have a very small sliver of time and price expansion left,” Rekt Capital said on Thursday, comparing the current cycle to the 2020 rally.
According to his analysis, the cycle may top out roughly 550 days after the April 2024 Bitcoin halving.
“That’s already two to three months potentially that we have left in this bull market,” he added.
Debate Over Halving Cycle Relevance
While Rekt Capital emphasizes the importance of sticking to time-tested halving models, others are more skeptical.
He criticized the growing trend of abandoning the halving narrative in favor of newer metrics like Bitcoin’s correlation with global M2 money supply.
“Many people are happy to throw away time-tested principles… whereas it’s really important to rely on these sorts of metrics,” he said.
He also called the shift an emotional move that clouds sound judgment.
Alternative Views Highlight Institutional Impact
Some analysts argue that traditional halving cycles are less relevant today due to rising institutional interest.
Standard Chartered’s Geoff Kendrick said on Thursday that, “Thanks to increased investor flows, we believe BTC has moved beyond the previous dynamic whereby prices fell 18 months after a ‘halving’ cycle.”
In May, Standard Chartered forecast Bitcoin reaching $200,000 by year-end, while Bernstein made a similar prediction.
BitMEX co-founder Arthur Hayes remains even more bullish, expecting Bitcoin to hit $250,000.
As of now, Bitcoin is trading at $109,155, just 2.5% below its all-time high of $111,970.
Crypto analyst Crypto Auris also commented recently that, “As global money supply expands, Bitcoin’s next target sits around ~$170K, following the flow.”
Analyst Emphasizes Caution Over Hype
Despite the bullish sentiment from others, Rekt Capital cautions against ignoring the halving-based cycle.
“It’s an emotional thing as well, and you don’t want emotional things clouding your judgement,” he reiterated.
Litecoin (LTC) has slipped beneath the $90 level, raising concerns among investors, but several technical and onchain signals suggest that a bullish reversal could be taking shape.
While the current price action may seem weak, analysts are pointing to a shift in market sentiment and upcoming macro events that could pave the way for a significant rally in the months ahead.
Market Activity Suggests Buyer Dominance Is Returning
One of the clearest signs of a potential bullish turnaround is seen in the 90-day Spot Cumulative Volume Delta (CVD).
This metric, which measures the balance between buy and sell pressure, turned positive for the first time since December 2024.
The flip to a “taker buy dominant” environment indicates that market participants are stepping in to accumulate LTC at current price levels.
The return of buy-side dominance often marks the early stages of a trend reversal and suggests that selling pressure is beginning to subside.
ETF Speculation Adds Fuel to the Fire
Further boosting bullish sentiment is the growing optimism around a potential Litecoin exchange-traded fund (ETF).
According to Bloomberg analysts, there is a 95% probability that the U.S. Securities and Exchange Commission will approve LTC, SOL, and XRP ETFs by October 2.
Such approval would mark a major milestone for Litecoin, opening the door for increased institutional participation and broader retail access.
The market often reacts positively in anticipation of such regulatory developments, which could provide a meaningful catalyst if confirmed.
Seasonal Weakness Could Delay Immediate Gains
Despite these positive indicators, historical trends suggest caution in the short term.
Data reveals that August and September have consistently been Litecoin’s weakest months, delivering average returns of -6.99% and -5.06% respectively since 2012.
However, these months are typically followed by a strong recovery, with November standing out as the most profitable period for LTC historically, boasting an average return of 94.79%.
If the anticipated ETF approval aligns with Litecoin’s seasonal pivot, the convergence of timing and sentiment could amplify the upside.
Price Structure Echoes 2024 Breakout Pattern
Technically, Litecoin’s daily chart is mimicking its 2024 setup, when a Q1 rally was followed by a correction throughout Q2.
This year, the price has once again retested a significant demand zone that served as a launchpad for a breakout in late 2024.
If LTC continues to accumulate within this zone, it may soon challenge the descending trendline that has contained its price for several months.
A successful breakout above the trendline, accompanied by a reclaim of the 50-day and 200-day moving averages, would provide a strong confirmation of bullish momentum heading into Q4.
Strategic Opportunity or Risk?
While price weakness persists for now, multiple layers of technical and fundamental signals suggest that current levels may present a strategic accumulation opportunity rather than a warning sign.
With institutional interest growing and technical setups pointing to historical parallels, the path forward for Litecoin could become significantly more optimistic if conditions align in the coming weeks.
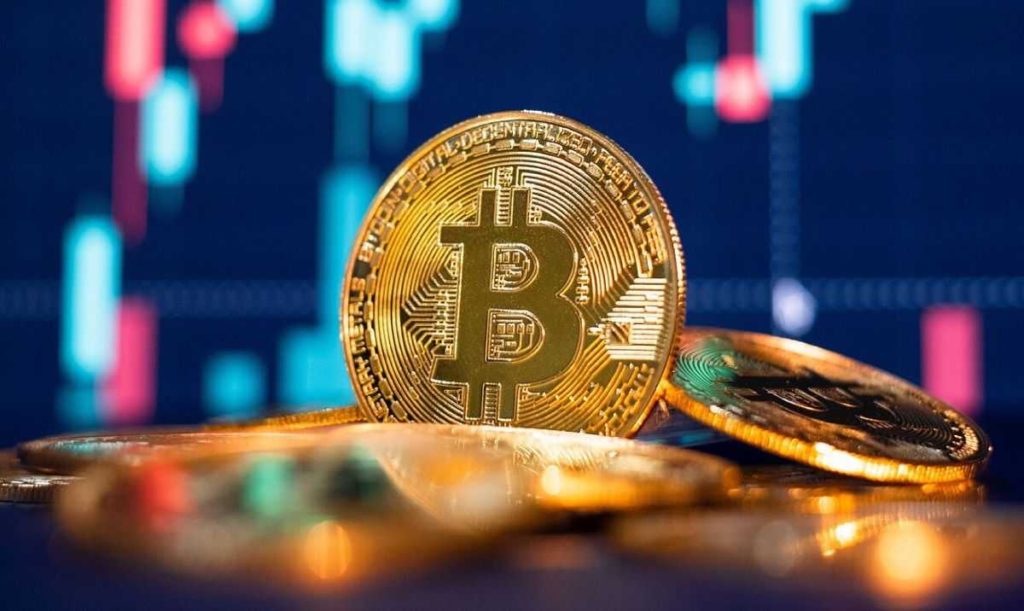
Bitcoin’s price has dropped nearly 2% to around $105,560 over the past day, but market sentiment remains relatively strong.
The Crypto Fear & Greed Index registered a score of 63 on Wednesday, down just one point from the previous day, indicating continued market confidence.
Bitcoin had nearly reached $108,000 on Tuesday before sliding into a short-term correction. Analysts are closely watching to see if the cryptocurrency will retest its all-time high of $111,970 set on May 22.
Historical Trends Cast Shadow Over Q3
Analysts have flagged the third quarter as historically slow for Bitcoin.
“From the historical data, this quarter is generally the slowest out of all, for both $BTC and $ETH,” said trader Daan Crypto Trades.
Since 2013, Bitcoin has averaged just a 5.47% gain during Q3. If the trend continues, Bitcoin could rise to about $111,000 by September 30.
Daan attributes the slower performance to “slower summer months where there’s generally less action, volumes [and] liquidity.”
Q2 Outperforms Averages
Bitcoin delivered a solid second quarter with a 31% gain, ending at $108,383—about 4% above the historical Q2 average of 27% since 2014. June also saw the asset print its highest monthly candle.
Despite short-term volatility, Bitcoin continues to dominate the crypto market.
Its dominance stands at 65.5%, up nearly 13% year-to-date, according to TradingView.
Meanwhile, CoinMarketCap’s Altcoin Season Index stands at 20 out of 100, suggesting it is still Bitcoin’s market.
However, CryptoQuant’s head of research Julio Moreno noted a waning bullish signal.
“Bitcoin Bull Score is in NEUTRAL territory now–50. Needs to be 60 or above for prices to sustain a rally,” Moreno said.
Solana’s native token SOL jumped 7% on Monday following confirmation of the launch of the first Solana ETF featuring staking capabilities.
The new product, set to debut Wednesday, ignited a wave of optimism among traders, briefly pushing SOL to $161 before settling at $157.
Innovative ETF Structure Bypasses SEC Approval
The ETF is being introduced by REX Shares in partnership with Osprey Funds.
To sidestep the traditional SEC approval process, they created a taxable C-corporation.
This structure, common in energy infrastructure investments, allows for quicker rollout but is less tax-efficient, taxing dividends at both the corporate and shareholder levels.
Despite the ETF’s novelty, investors tempered expectations, recognizing that similar instruments could easily emerge for other altcoins.
Limited Institutional Demand Raises Questions
Grayscale’s Solana Trust (GSOL), operating for over two years, manages just $75 million in assets.
By comparison, Grayscale’s Ethereum Trust held $10 billion one month before the Ethereum ETF’s launch.
This discrepancy suggests that institutional appetite for SOL may be modest, even with the new ETF’s added staking feature.
Staking Unlocks and DApp Selling Apply Pressure
SOL’s rally faces additional hurdles.
Roughly $585 million in SOL will unlock from staking in the next two months, adding potential sell pressure.
Major Solana-based DApps have also offloaded significant holdings.
In 2025 alone, the token launch platform Pump sent $404 million worth of SOL to exchanges.
These sales may explain why SOL has moved in line with ETH and BNB over the past 30 days despite the ETF announcement.
Funding Rates and Network Metrics Offer No Strong Support
SOL’s annualized funding rate, a key leverage indicator, remains under 10%, indicating muted bullish sentiment.
Meanwhile, Solana’s network revenue has plummeted over 90% since January.
Even the rise in memecoin activity has failed to restore network health.
The launch of tokenized stock trading on Ethereum’s layer-2 solutions, including partnerships with Robinhood and Coinbase, further undermines Solana’s appeal in the high-performance DApp sector.
While the ETF has stirred interest, competition and weak fundamentals make a sustained rally above $200 unlikely for now.
Cryptocurrency-linked payment cards are rapidly gaining traction in Europe, particularly for small purchases typically dominated by cash.
According to a new report from CEX.IO, 45% of crypto card transactions fall under the 10-euro mark, reflecting a shift in consumer behaviour and highlighting crypto’s growing role in day-to-day payments.
The report, shared with Cointelegraph, noted a 15% year-on-year increase in newly issued CEX.IO crypto cards across the continent in 2025.
This trend indicates a broader acceptance of digital assets as a means for routine purchases and suggests that crypto cardholders are now mirroring traditional banking habits, especially when it comes to online spending.
Online Spending Nearly Doubles Traditional Usage Rates
While the European Central Bank (ECB) reports that 21% of card payments in the eurozone are made online, CEX.IO data shows that 40% of crypto card transactions occur via the internet.
This figure nearly doubles the regional average, showcasing the comfort crypto users have with digital platforms.
“What we’re seeing in Europe is that crypto card users aren’t just experimenting with new tech — they’re showing us what everyday spending might look like in a truly cashless future,” said Alexandr Kerya, Vice President of Product Management at CEX.IO.
He also revealed that average payment volumes have jumped 24% in the past month alone.
Crypto Spending Patterns Mirror Traditional Banking
The data further illustrates how crypto cardholders are incorporating digital currencies into their daily routines.
Groceries represent 59% of crypto card purchases, which is close to the ECB’s 54% average for traditional bank cards.
Spending at restaurants and bars accounts for 19% — a higher figure than typical bank card usage in that category.
The average crypto card transaction stands at €23.70, lower than the €33.60 average for traditional bank card payments, based on Mastercard’s Q1 2025 data.
Stablecoins Lead Transactions as Other Cryptos Gain Ground
Stablecoins play a dominant role in these transactions, powering 73% of all crypto card activity.
Nevertheless, other leading digital assets such as Bitcoin, Ether, Litecoin, and Solana are also being used for essentials like groceries, dining, and transport.
This mirrors broader usage trends across the crypto sector.
For example, platforms like Oobit and Crypto.com are also reporting strong transaction volumes related to everyday spending and online shopping across their European user base.
Institutional Pushbacks Continue Despite Adoption Gains
However, not all financial institutions are welcoming this trend.
Barclays has announced that it will block crypto purchases on its Barclaycard credit cards.
The bank cited concerns over the volatility of digital assets and the lack of consumer protections available through traditional financial mechanisms.
Barclays emphasized that crypto transactions are not covered by the Financial Ombudsman Service or the Financial Services Compensation Scheme, leaving users exposed in case of disputes or losses.
Despite such institutional caution, the momentum behind crypto card usage continues to grow, reflecting an evolving financial landscape that is increasingly embracing digital innovation.
Only a limited number of Bitcoin treasury companies are expected to weather the storm as market conditions tighten, according to a recent report from venture capital firm Breed.
The report highlights the risk of a “death spiral” for firms holding Bitcoin that trade near their net asset value (NAV), potentially leading to widespread market instability.
The Role of MNAV in Treasury Company Resilience
The success of Bitcoin treasury companies is closely tied to their ability to maintain a market value that exceeds their NAV, referred to as MNAV.
According to Breed, the higher this multiple, the greater the firm’s ability to attract critical debt and equity financing needed for converting fiat capital into Bitcoin.
When this premium erodes, the risk of financial instability increases sharply.
Breed outlined a seven-stage process that begins with a decline in Bitcoin’s price.
As Bitcoin value falls, so does the company’s MNAV, bringing share prices closer to their underlying NAV.
This dynamic reduces investor confidence and makes it increasingly difficult to raise additional capital.
This lack of access to fresh credit, combined with looming debt maturities, can trigger margin calls.
Firms may be forced to liquidate their Bitcoin holdings at inopportune times, further depressing the asset’s price.
This may result in a consolidation wave, with stronger companies absorbing weaker ones, potentially leading to a broader crypto market downturn.
“Ultimately, only a select few companies will sustain a lasting MNAV premium,” Breed’s report stated.
“They will earn it through strong leadership, disciplined execution, savvy marketing, and distinctive strategies that continue to grow Bitcoin-per-share regardless of broader market fluctuations.”
Equity Financing Provides Some Market Protection
The report notes that the potential fallout from the “death spiral” may be limited, at least in the near term.
Breed’s researchers said most Bitcoin treasury companies are currently funding their operations through equity rather than debt.
This reduces the risk of forced Bitcoin sales due to debt pressures, which could otherwise cause more significant market disruptions.
However, this balance could shift in the future.
If debt financing becomes more attractive or widespread, the sector might face deeper vulnerabilities, increasing the chance of systemic risk.
Treasury Bitcoin Holdings Surge in 2025
The corporate Bitcoin treasury trend has grown rapidly, especially since 2020 when Michael Saylor’s company, Strategy, began acquiring large quantities of Bitcoin as part of its financial strategy.
Since then, the idea has caught on across the financial world.
In 2025, over 250 entities now hold Bitcoin as a treasury asset.
These include corporations, pension funds, ETFs, government agencies, and crypto service providers.
Breed’s report warns that only a fraction of these entities are structurally sound enough to withstand extended volatility and maintain a MNAV advantage.
The concern is that others, particularly those heavily reliant on market price appreciation and external financing, may not survive prolonged market downturns.
As competition intensifies and the market consolidates, only the most disciplined and strategically agile companies will likely remain standing.